METHODOLOGY
How to Read Market Context Without Treating It as a Buy Signal
A bullish model and weak index tape can both be true. Read Market Context as separate evidence about the U.S. growth-stock environment, then let your own Constitution decide what that evidence means for a proposed long or short.
BY TRADEREGIMEN EDITORIAL / PUBLISHED / UPDATED · 10 MIN READ
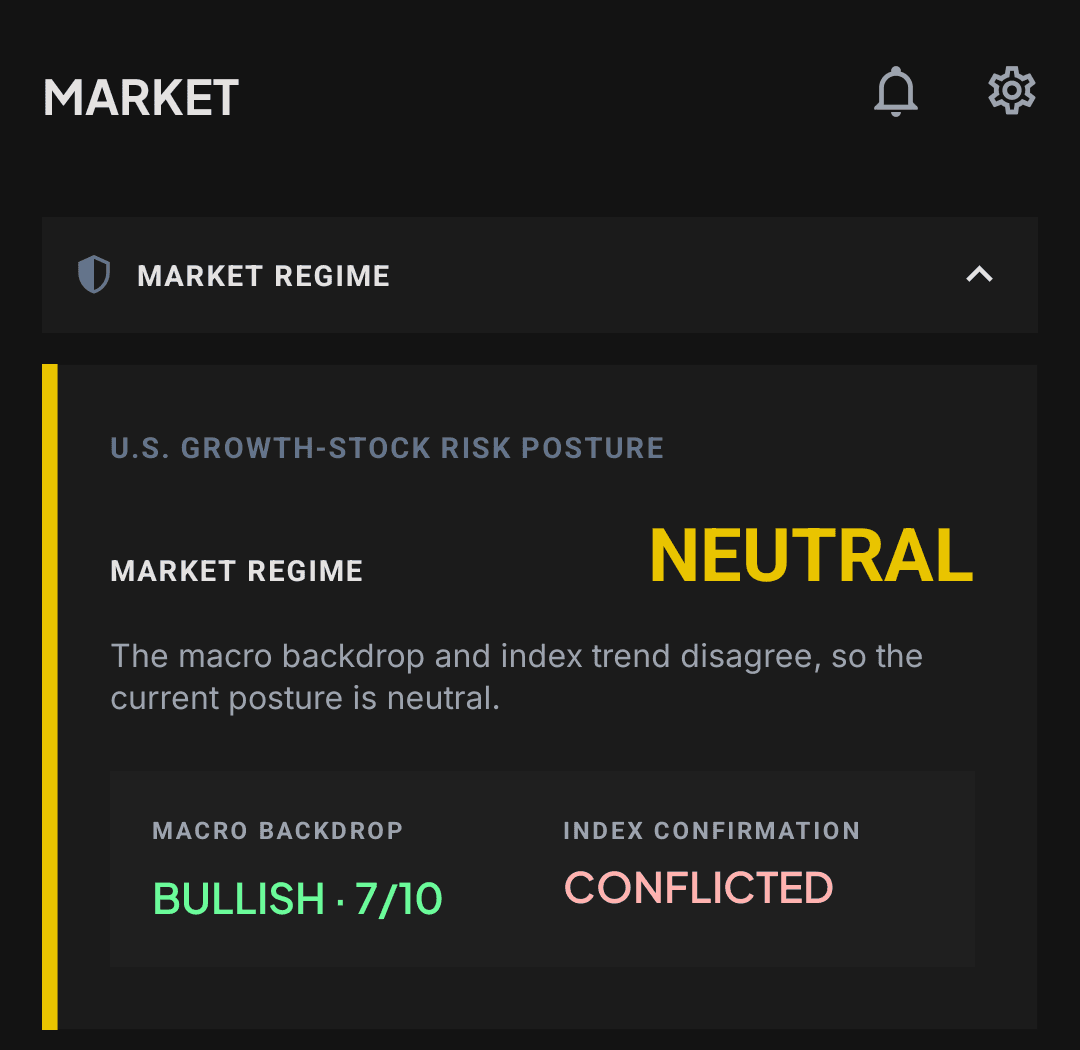
The screen says the model is bullish, but the risk posture is Neutral. That is not necessarily a contradiction or a broken score. It means two different evidence groups disagree.
The useful reading order is: model backdrop, SPY and QQQ tape, broader participation, sector and theme leadership, then your saved rule. None of those facts is a buy or sell command. The final trading decision remains yours.
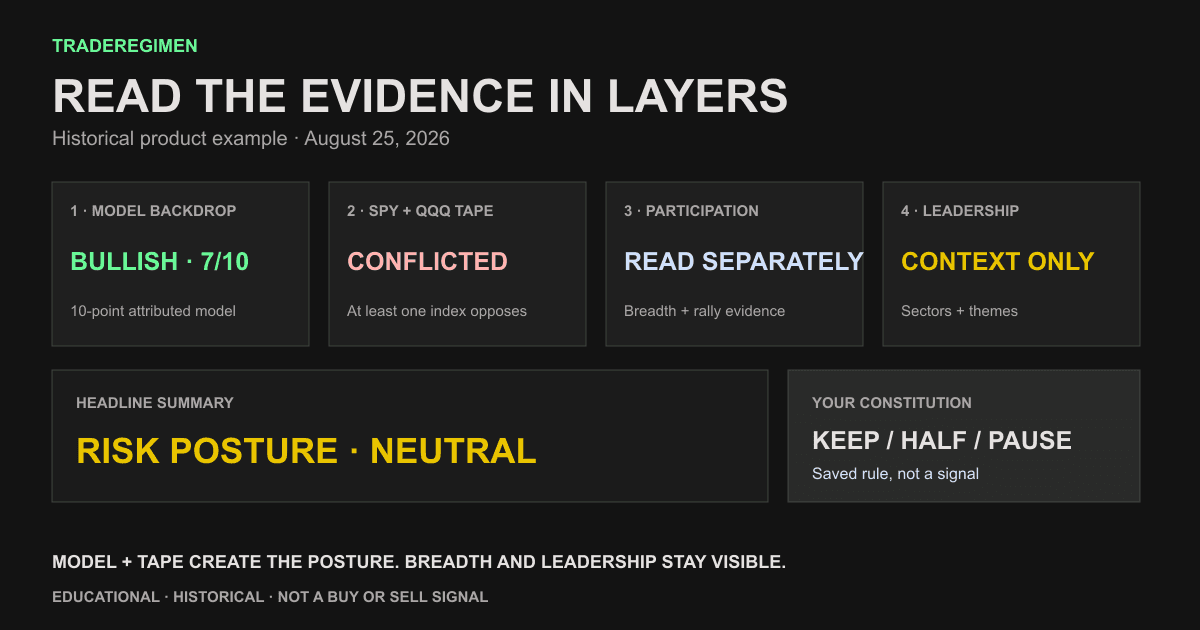
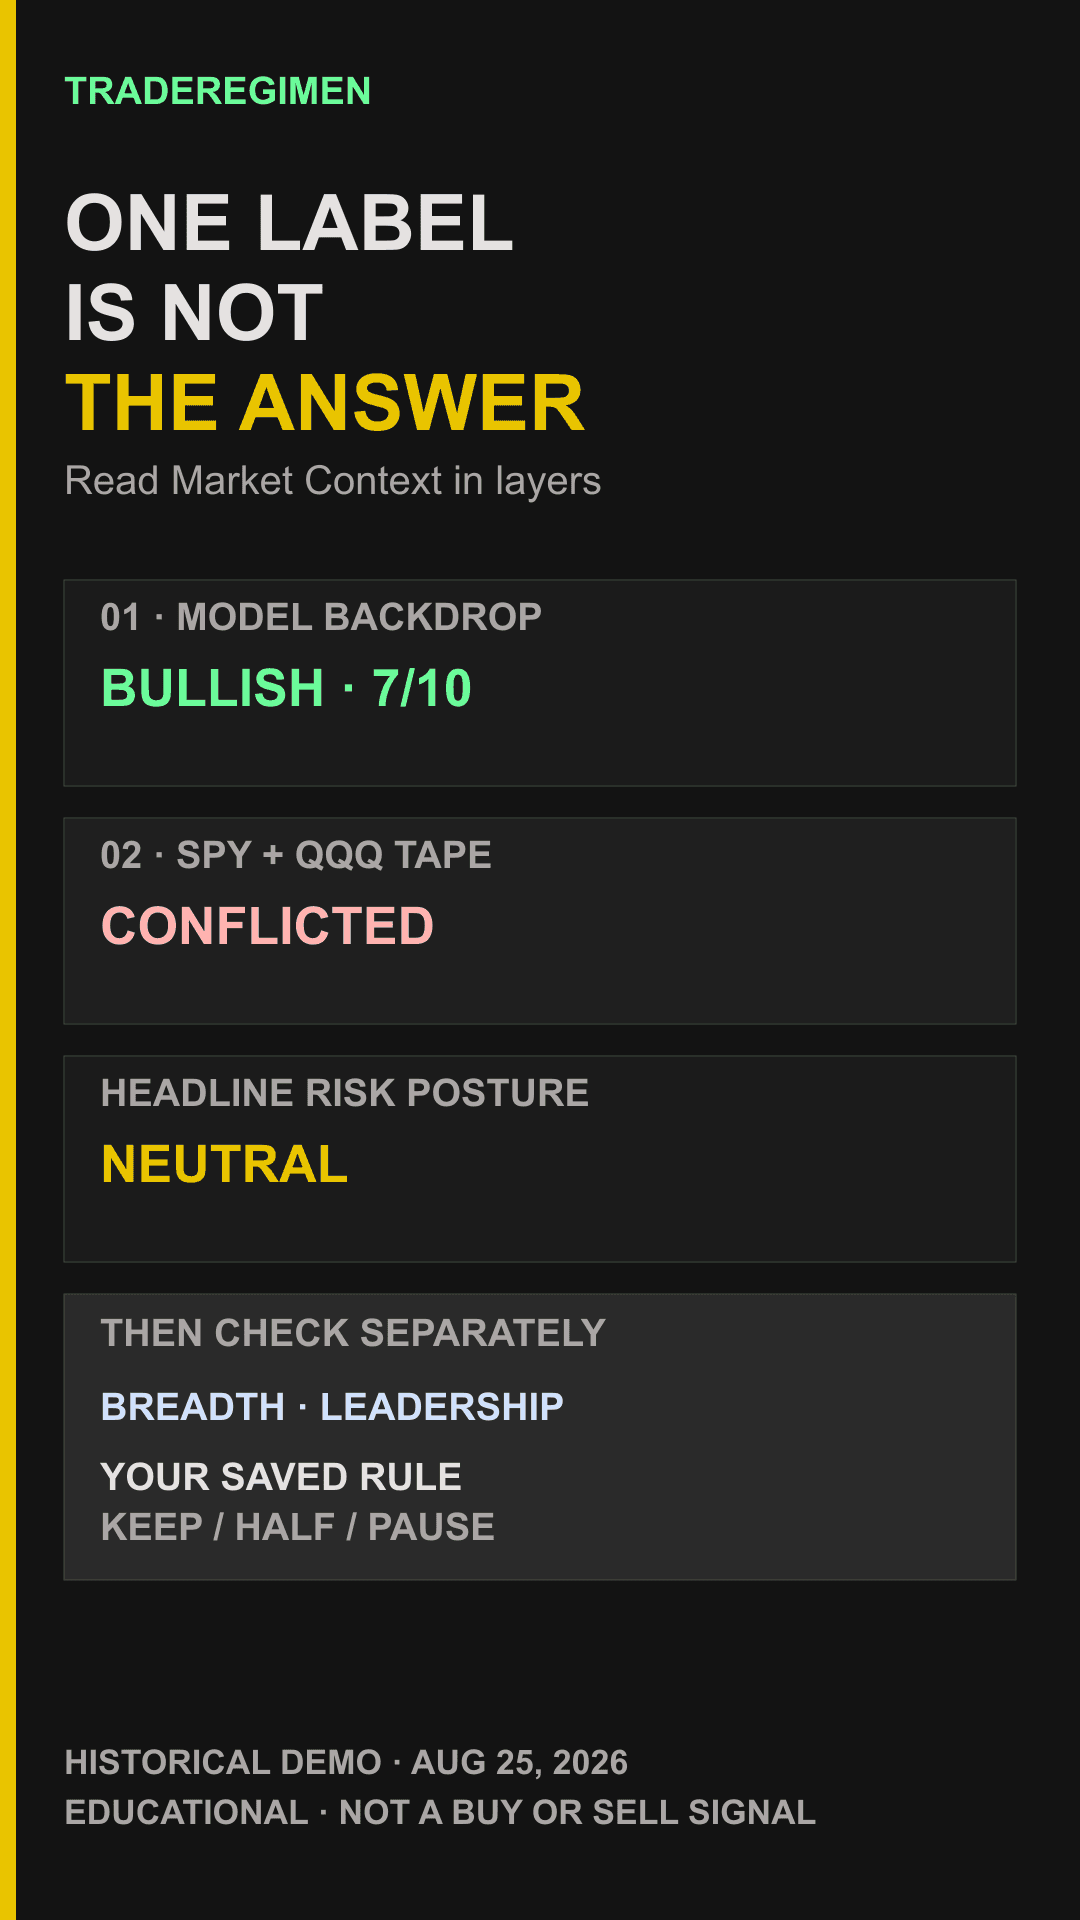
Market Context organizes evidence. It does not turn a model reading into permission to trade.
A real disagreement is more useful than a blended score
This seeded app state was captured on August 25, 2026. The attributed model read Bullish at 7/10, at least one broad index opposed that direction, and the combined risk posture was Neutral. The screenshot is historical product evidence, not a statement about today's market.
1. Start with the attributed model backdrop
TradeRegimen's 10-point market backdrop is attributed to Martin Zweig's framework, but its current inputs, weights, and thresholds are a TradeRegimen implementation, not a reproduction of his original model. It has eight monetary points and two momentum points. The interface preserves the score and its classification, including Max Bullish, Bullish, Neutral, Bearish, and Max Bearish. Those labels belong to the model output only.
The monetary inputs use current and historical series that include the effective federal funds rate, bank prime loan rate, and nonrevolving consumer credit. The product shows source dates because a score is only as current as its inputs. VIX, Treasury yields, the dollar, breadth, sectors, and themes can appear elsewhere on the Market screen, but they are not hidden extra points in this 10-point score.
2. Check SPY and QQQ separately
Here, tape means daily and weekly index evidence, not Level II or live order flow. The layer evaluates four observations for each index. An index is Up only when at least three observations vote Up, and Down only when at least three vote Down. Anything else is Mixed, unless every observation for that index is unavailable.
- Daily 10/20: the close, 10-day simple moving average, and 20-day simple moving average must be stacked in one direction.
- Weekly 10/20: the latest weekly close and 10- and 20-week weighted moving averages must be stacked in one direction.
- 5-day trend: the close, current 5-day average, and prior-session 5-day average must be stacked in one direction.
- New highs versus new lows: NYSE breadth is paired with SPY and Nasdaq breadth with QQQ. More highs vote Up; more lows vote Down; a tie is Mixed.
Missing data never becomes a bearish vote. It stays Unavailable so the reader can see the gap.
Agreement and risk posture answer different questions
Cross-Signal Agreement asks how the confirmed SPY and QQQ directions compare with the model direction. The headline risk posture translates that relationship into Risk-On, Neutral, Risk-Off, or Unavailable. Agreement is an audit label; posture is a compact presentation label.
| Model | SPY | QQQ | Agreement | Risk posture | Why |
|---|---|---|---|---|---|
| Up | Up | Up | High | Risk-On | Both confirm |
| Up | Up | Mixed | Mixed | Risk-On | One confirms; none opposes |
| Up | Mixed | Down | Low | Neutral | An index opposes |
| Neutral | Up | Up | Mixed | Neutral | Model has no direction |
One confirming index with no opposition is enough for a directional risk posture even though agreement remains Mixed. That is why the two labels should not be treated as synonyms. The separate Market Environment card is stricter about coverage: it needs both SPY and QQQ to summarize their combined health.
3. Read participation beside the headline
Breadth asks whether participation extends beyond the index level. TradeRegimen displays recent NYSE and Nasdaq breadth as a separate fact group. The Follow-Through Day tracker is separate again: it follows rally-attempt, price, volume, invalidation, and distribution-day rules. The separate aggregate Breadth panel and Follow-Through Day state are not blended into Cross-Signal Agreement. New highs versus new lows already contribute once within each index's four tape observations. For the formula and limitations of a different, named breadth condition, see the Zweig Breadth Thrust guide.
This separation matters when the indexes rise on narrow leadership, or when participation improves before the longer model catches up. You can inspect the disagreement without pretending it has already resolved.
4. Check where leadership is concentrated
Sector rankings and theme rotation answer a different question: where relative strength is appearing. They can help explain why a broad index feels uneven, but they do not change the model score, tape votes, agreement level, or Constitution rule. Treat them as context for selectivity, not as a hidden signal.
The related Market dashboard guide shows how the regime, environment, breadth, and Follow-Through Day views fit together without collapsing them into one number.
5. Let the Constitution own the response
Market Context describes the environment. The Constitution evaluates a proposed direction. A long plan expects an Up model; a short plan expects Down. The selected tape requirement can ask for no index check, at least one confirming index with neither opposing, or both indexes confirming.
When Market Context sizing is enabled, current Constitutions begin with a conservative default: SPY or QQQ confirms, with neither opposing, and Limit to Half Size when that test conflicts. The user can review and change those settings. A saved mismatch response can:
- Keep Normal Size: show the conflict without reducing the calculated limits.
- Limit to Half Size: cap risk and position value at 50%, with no more than three open positions.
- Pause New Positions: show a blocker and calculate zero shares for the new plan.
Pause New Positions is an in-app planning rule. TradeRegimen does not place, reject, cancel, or manage brokerage orders. For the exact share calculation after a rule is evaluated, use the portfolio-constrained position-sizing guide.
A one-minute reading checklist
- Read the risk posture, then immediately inspect the model and index-confirmation labels beneath it.
- Check the model score, classification, and source dates. Do not treat the classification as the final answer.
- Open SPY and QQQ details. Count which observations are Up, Down, Mixed, or Unavailable.
- Read breadth and the Follow-Through Day state as separate participation evidence.
- Check sectors and themes for concentration or rotation without feeding them back into the agreement label.
- Open Constitution settings and verify the rule that applies to the proposed long or short.
What can make the reading incomplete
- Stale or missing inputs: source dates matter. Missing observations remain Unavailable rather than becoming negative votes.
- A compact label hides detail: Risk-On can coexist with Mixed agreement when only one index confirms and neither opposes.
- Context is not timing: a supportive environment does not establish a valid setup, entry, stop, or share count.
- Moving averages lag: they summarize historical prices and can whipsaw in choppy conditions. A tape vote cannot identify an exact turning point.
- Recorded data can be wrong: market and third-party data can be delayed, incomplete, or incorrect. Verify material decisions independently.
What is visible on Free and Pro
Free users can see the core model classification and score, agreement level, and risk posture. Pro adds the raw model components, SPY and QQQ observation rows and source dates, plus deeper sector and theme detail. Check the current pricing page for the current offer and platform terms.
Sources and review context
- CMT Association's Martin Zweig retrospective and Hachette's publisher record for Winning on Wall Street support the attribution. They do not validate TradeRegimen's current inputs, weights, thresholds, or predictive value.
- Federal Reserve Bank of St. Louis: effective federal funds rate, bank prime loan rate, and nonrevolving consumer credit.
- Charles Schwab's moving-average crossover overview explains the lag and whipsaw limitations of moving-average signals. TradeRegimen's periods and three-of-four tape rule are its own documented implementation.
- Product behavior and labels were reviewed against the current TradeRegimen Market Context, tape, Constitution, and access-control implementation on September 14, 2026. See the editorial policy for the verification and correction process.
For the full onboarding sequence, continue with the TradeRegimen Start Here path. This material is educational and informational, not individualized investment advice. Read the full product and market-data disclaimer.
FREQUENTLY ASKED
Does a Neutral Market Regime mean the market will move sideways?
No. Neutral describes the current relationship among the model direction and index confirmation. It can appear when the model itself is neutral, when neither index confirms a directional model, or when an index opposes it. It is not a forecast of the next move.
How is Market Environment different from Cross-Signal Agreement?
Market Environment summarizes the current SPY and QQQ directions together. Cross-Signal Agreement compares those index directions with the attributed model direction. The separate aggregate Breadth panel does not enter either calculation, although new highs versus new lows provide one of each index's four tape observations.
Can TradeRegimen block a trade when Market Context conflicts?
It can show a blocker and calculate zero new shares inside its planning workflow when the user's saved action is Pause New Positions. It cannot prevent, cancel, or manage an order at the broker.
Run your trading like a system.
Build your Constitution, check a manual position plan when you log it, and review rule states while recorded positions are open.
Get Started