METHODOLOGY
What Is the Zweig Breadth Thrust?
The standard Zweig Breadth Thrust formulation measures an unusually fast expansion in NYSE participation. Its formula is specific, its data assumptions matter, and the result is context rather than a forecast or an instruction to change size.
BY TRADEREGIMEN EDITORIAL / PUBLISHED / UPDATED · 7 MIN READ
A broad rally day can look dramatic without producing a Zweig Breadth Thrust. The named condition applies two thresholds to a smoothed series, then requires the move between them to happen inside a short window. Skip any one of those details and you are measuring something else.
The useful reading is narrow: participation changed quickly across the chosen NYSE issue universe. The condition does not identify a stock entry, establish a stop, guarantee a positive return, or decide how much account risk belongs in a new position.
A breadth thrust is an observed participation condition. It is not a promise about the next trade.
The standard calculation
1. Calculate the daily breadth ratio
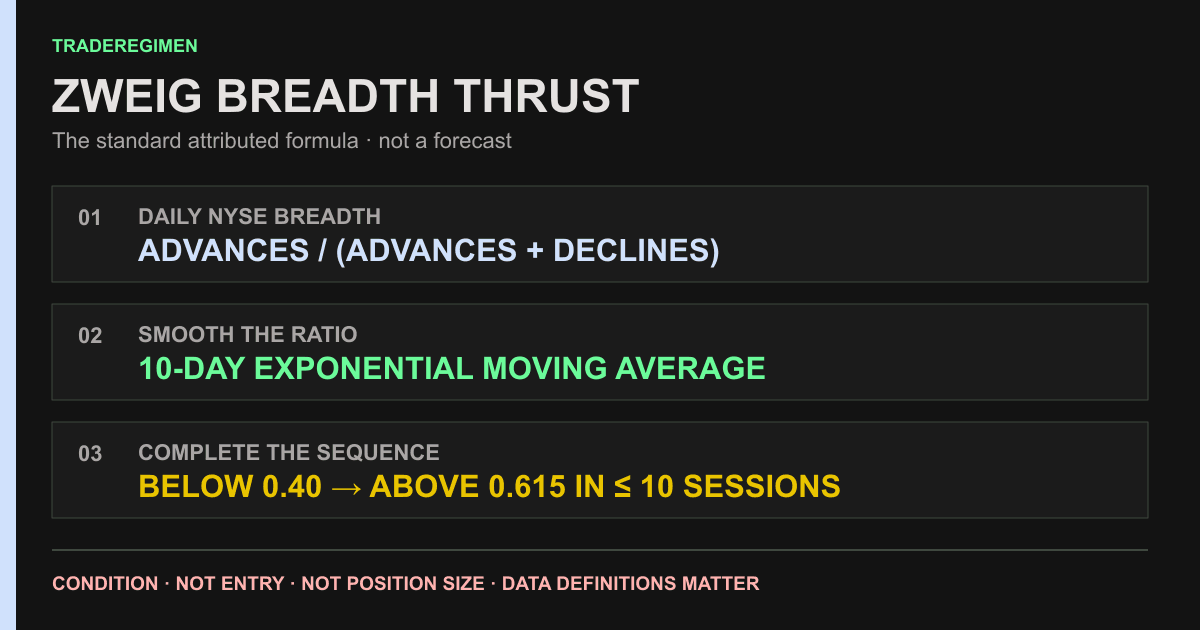
Daily breadth ratio = NYSE advancing issues / (advancing issues + declining issues)
A value of 0.60 means 60% of the advancing-plus-declining issue count finished higher for that session. Unchanged issues are not in this denominator. Confirm that a data vendor is using a comparable NYSE universe before treating two ratios as interchangeable.
2. Smooth the ratio with a 10-day EMA
The standard modern formulation attributed to Martin Zweig uses a 10-day exponential moving average, or EMA, of the daily ratio. An EMA gives more weight to recent sessions while retaining information from earlier observations. The threshold test applies to this smoothed series, not the raw ratio from one day.
3. Apply both thresholds and the time window
- The 10-day EMA records a value below 0.40.
- It later records a value above 0.615.
- The move between those observations takes no more than 10 trading sessions.
That sequence is the definition used in the sources below. A chart that uses a simple moving average, compares a raw daily ratio with a smoothed value, changes the thresholds, or relaxes the window should be labeled as a variant rather than an exact reproduction.
Why two implementations can disagree
- Issue universe: one provider may include or exclude funds, preferred shares, or other listings differently.
- Session handling: holidays, missing observations, late corrections, and market-calendar alignment can shift the window.
- EMA initialization: a short data history and a long warm-up history can produce slightly different early values.
- Threshold rules: below versus at-or-below, above versus at-or-above, and how the 10 sessions are counted all matter.
Record the provider, issue definition, source dates, EMA method, and threshold convention before comparing a historical signal list. Without that information, a count of signals or returns is not reproducible.
What the condition can and cannot establish
The formula can establish that the selected breadth series moved from a depressed reading to a high reading quickly. Traders may interpret that as evidence of expanding participation, but the calculation does not identify what caused the move. It cannot prove coordinated institutional buying, short covering, or a lasting change in the market cycle.
Historical examples are sensitive to the exact dataset and start date. TradeRegimen does not publish a verified signal table or return study, so this guide makes no claim about a perfect record, typical forward return, or fixed holding period. Past observations do not remove market, model, execution, or loss risk.
How it differs from TradeRegimen Market Context
The attributed 10-point model uses eight monetary points and two momentum points. SPY and QQQ tape, the aggregate Breadth panel, Follow-Through Day state, sector or theme leadership, and the current 10-Day Breadth Monitor remain separate evidence. The breadth monitor does not enter the model score, Cross-Signal Agreement, risk posture, or Constitution sizing.
TradeRegimen's current 10-Day Breadth Monitor is intentionally not presented as the standard ZBT. It uses an implementation-specific simple average of the latest 10 stored NYSE advance-decline ratios. It marks the state active when the oldest ratio in that 10-session set is below 0.40 and the current simple average is above 0.615. That is not the classic EMA sequence. Its internal response key is retained for compatibility, but the customer-facing label distinguishes the two calculations.
For the complete reading order and the saved-rule boundary, use the Market Context guide. A breadth observation can prompt further review; it does not override the other layers or restore a universal position size.
A verification checklist
- Confirm that the chart uses NYSE advancing issues divided by advancing plus declining issues.
- Confirm that the smoothed series is a 10-day EMA rather than a simple average.
- Locate the actual observation below 0.40.
- Count trading sessions to the observation above 0.615.
- Check source dates and any missing or revised sessions.
- Keep setup, invalidation, size, and broker execution as separate decisions.
Sources and review context
- The CMT Association's Martin Zweig retrospective describes the 40%, 61.5%, and 10-day condition. It does not support a perfect-record or guaranteed-return claim.
- StockCharts' calculation explainer states the common 10-day EMA formulation. It is practitioner education, not an independent performance study.
- Hachette's publisher record for Winning on Wall Street supports bibliographic attribution, not the deleted performance claims.
- Product behavior was reviewed against the current breadth, model, tape, agreement, and Constitution implementations on September 14, 2026. See the editorial policy for the correction process.
This material is educational and informational, not individualized investment advice. Read the full product and market-data disclaimer.
FREQUENTLY ASKED
What is the Zweig Breadth Thrust?
The standard formulation attributed to Martin Zweig is a condition in which a 10-day exponential moving average of NYSE advancing issues divided by advancing plus declining issues moves from below 0.40 to above 0.615 within 10 trading sessions. It describes a rapid expansion in participation; it does not guarantee a rally.
Is one strong advance-decline day a Zweig Breadth Thrust?
No. The thresholds apply to the smoothed 10-day series, not to one day's raw advance-decline ratio. A single broad rally day can affect the series without completing the condition.
Why can two Zweig Breadth Thrust charts disagree?
Providers can use different issue universes, treatments of unchanged issues, session cutoffs, missing-day policies, and EMA initialization. Those choices can change both the smoothed value and whether the two thresholds were crossed inside the required window.
Does TradeRegimen's current breadth monitor reproduce the classic ZBT?
No. TradeRegimen currently labels its product calculation 10-Day Breadth Monitor. It uses an implementation-specific simple average of stored NYSE breadth ratios and remains separate from the classic EMA sequence, the attributed 10-point model, Cross-Signal Agreement, risk posture, and Constitution sizing.
Run your trading like a system.
Build your Constitution, check a manual position plan when you log it, and review rule states while recorded positions are open.
Get Started