METHODOLOGY
How to Build a Momentum Watchlist With Moving-Average Alignment
A useful momentum watchlist is a small set of candidates with a dated reason to be there, current evidence, a defined next decision, and a removal rule. Stage, relative strength, relative volume, and moving-average alignment can narrow the review; none of them supplies the entry.
BY TRADEREGIMEN EDITORIAL / PUBLISHED / UPDATED · 9 MIN READ
A list of 60 symbols can feel organized while still creating 60 open questions. Why is each name there? Which evidence is current? What has to happen next? What would make you remove it? If the row cannot answer those questions, the watchlist is storing attention rather than directing it.
The fix is deliberately plain: give every candidate the same four columns. The market still decides what happens. The worksheet only decides what deserves another look.
A watchlist should remove decisions, not collect tickers.
Give every candidate four columns
| Column | What belongs there |
|---|---|
| Candidate | Why this symbol earned a place on the list. Use one concrete reason, not 'looks interesting.' |
| Evidence + as-of | The dated Stage, RS, moving-average, volume, range, or setup facts that support the reason. |
| Next decision | The one condition that would justify another review. This is a review instruction, not an automatic order. |
| Invalidation or removal | What makes the original reason false, too stale, or no longer worth monitoring. |
This structure separates two jobs that are easy to blur. Screening decides which charts qualify for attention. A setup and risk plan decide whether one of those charts is actionable. A symbol can pass every watchlist filter and still have no usable entry.
A worked example: from candidate to next decision
Suppose a fictional Candidate A entered the list after a constructive weekly base. At the September 11 close, the evidence reads Stage 2, RS 91, price above all four tracked daily averages, and 0.8x relative volume. Its fictional $48.40 price is 3.2% below a $50.00 recorded 52-week high.
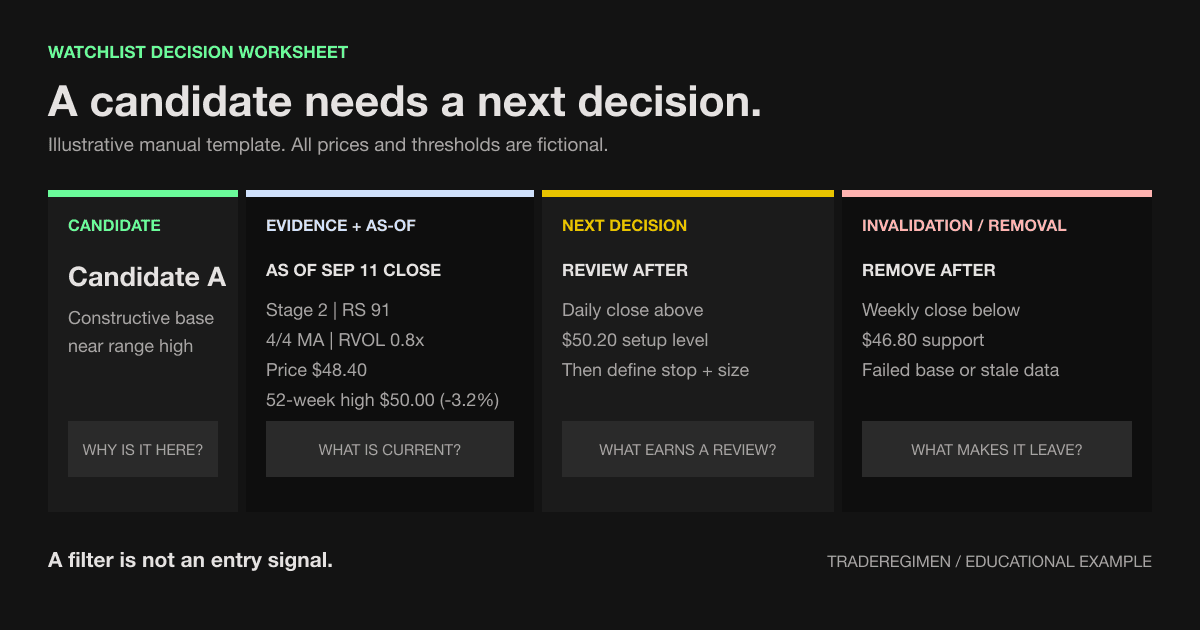
| Candidate | Evidence + as-of | Next decision | Invalidation or removal |
|---|---|---|---|
| Candidate A Constructive weekly base near its range high | Sep 11 close: Stage 2; RS 91; 4/4 above the tracked averages; 0.8x RVOL; $48.40 price versus a $50.00 52-week high (-3.2%) | Review after a daily close above the fictional $50.20 setup level; then define the stop and calculate size | Remove after a weekly close below the fictional $46.80 support level, a failed base, or evidence that is too old to trust |
The $50.20 and $46.80 levels are illustrative, not recommended thresholds. More importantly, the first one says review, not buy. A fresh chart review still has to check liquidity, earnings or event risk, market context, a defensible invalidation level, and the portfolio rules that limit size.
Freshness belongs beside the evidence
A watchlist row can combine fields with different useful refresh cadences. Treating them as though they arrived at the same instant can create false precision.
Daily or completed-period evidence
- 10-day and 20-day exponential moving averages
- 50-day, 150-day, and 200-day simple moving averages
- Stage classification from completed weekly bars
- trailing relative strength and five-session change
- CANSLIM inputs and setup annotations when sufficient data is available
Short-lived session state
- current price and change from the previous close
- current-session volume and its relative-volume estimate
Relative volume changes through the session. A reading before lunch is not directly comparable with the same ratio at the close when current volume is being compared with a typical full session. Missing values are also information: they should remain unavailable rather than being silently counted as passes.
Existing rows can remain visible after some refresh failures. A rejected membership or summary request produces a warning, but the server can also return cached fallback rows without a per-row stale marker. The top-level as-of label is the latest dated daily row in the response; it does not prove that every Stage, RS, CANSLIM, price, or quote field shares that timestamp. Verify the underlying source when exact freshness matters.
Read each filter for the job it actually does
- Stage describes the broader stock-cycle context. It does not grade today's entry.
- Relative strength ranks trailing performance using the available comparison method. It is not RSI, and a high reading does not establish a setup.
- Relative volume compares current participation with a typical session. The time of day and data timestamp matter.
- Moving-average alignment describes price location and, under a stricter test, the order of the averages.
- Range position says where price sits relative to the recorded 52-week high. It does not define a chart trigger.
These lenses can disagree. A high-RS stock can lose its 50-day average. A 4/4-aligned stock can trade on ordinary volume. A Stage 2 label can remain present while the entry is extended. Disagreement is a reason to inspect the chart, not an error to hide.
4/4 alignment is not the same as a bullish stack
TradeRegimen's alignment count compares price with four reference lines: the 10 EMA, 20 EMA, 50 SMA, and 200 SMA. A result of 3/4 means price is above three available averages. A result of 4/4 means it is above all four.
A bullish stack is stricter. It requires price > 10 EMA > 20 EMA > 50 SMA > 200 SMA. The count answers, “How many averages are below price?” The stack asks whether the entire trend structure is ordered. Neither one accounts for the quality or location of a specific entry.
Within 10% of the high is not your trigger
In TradeRegimen, the Within 10% of high filter means the current price is at least 90% of the recorded 52-week high. It is a broad location test. A trader-defined trigger might instead be a breakout above a base, an undercut-and-rally reclaim, or another exact condition from the chosen setup.
Within 10% of high is a location filter, not a saved entry trigger. TradeRegimen does not currently save a custom entry trigger or invalidation level in a watchlist row. Record those two decisions in your trade plan, journal, or separate worksheet rather than pretending the range filter supplies them.
How TradeRegimen narrows the roster
In the current U.S.-only app, the Pro Watchlist supports up to 100 symbols and shows a top-level as-of date for its daily summary. You can search or bulk-add symbols, filter the full loaded roster by Stage, minimum RS, daily trend, CANSLIM score, relative volume, proximity to the 52-week high, and moving-average position, then sort or choose the row fields you need.
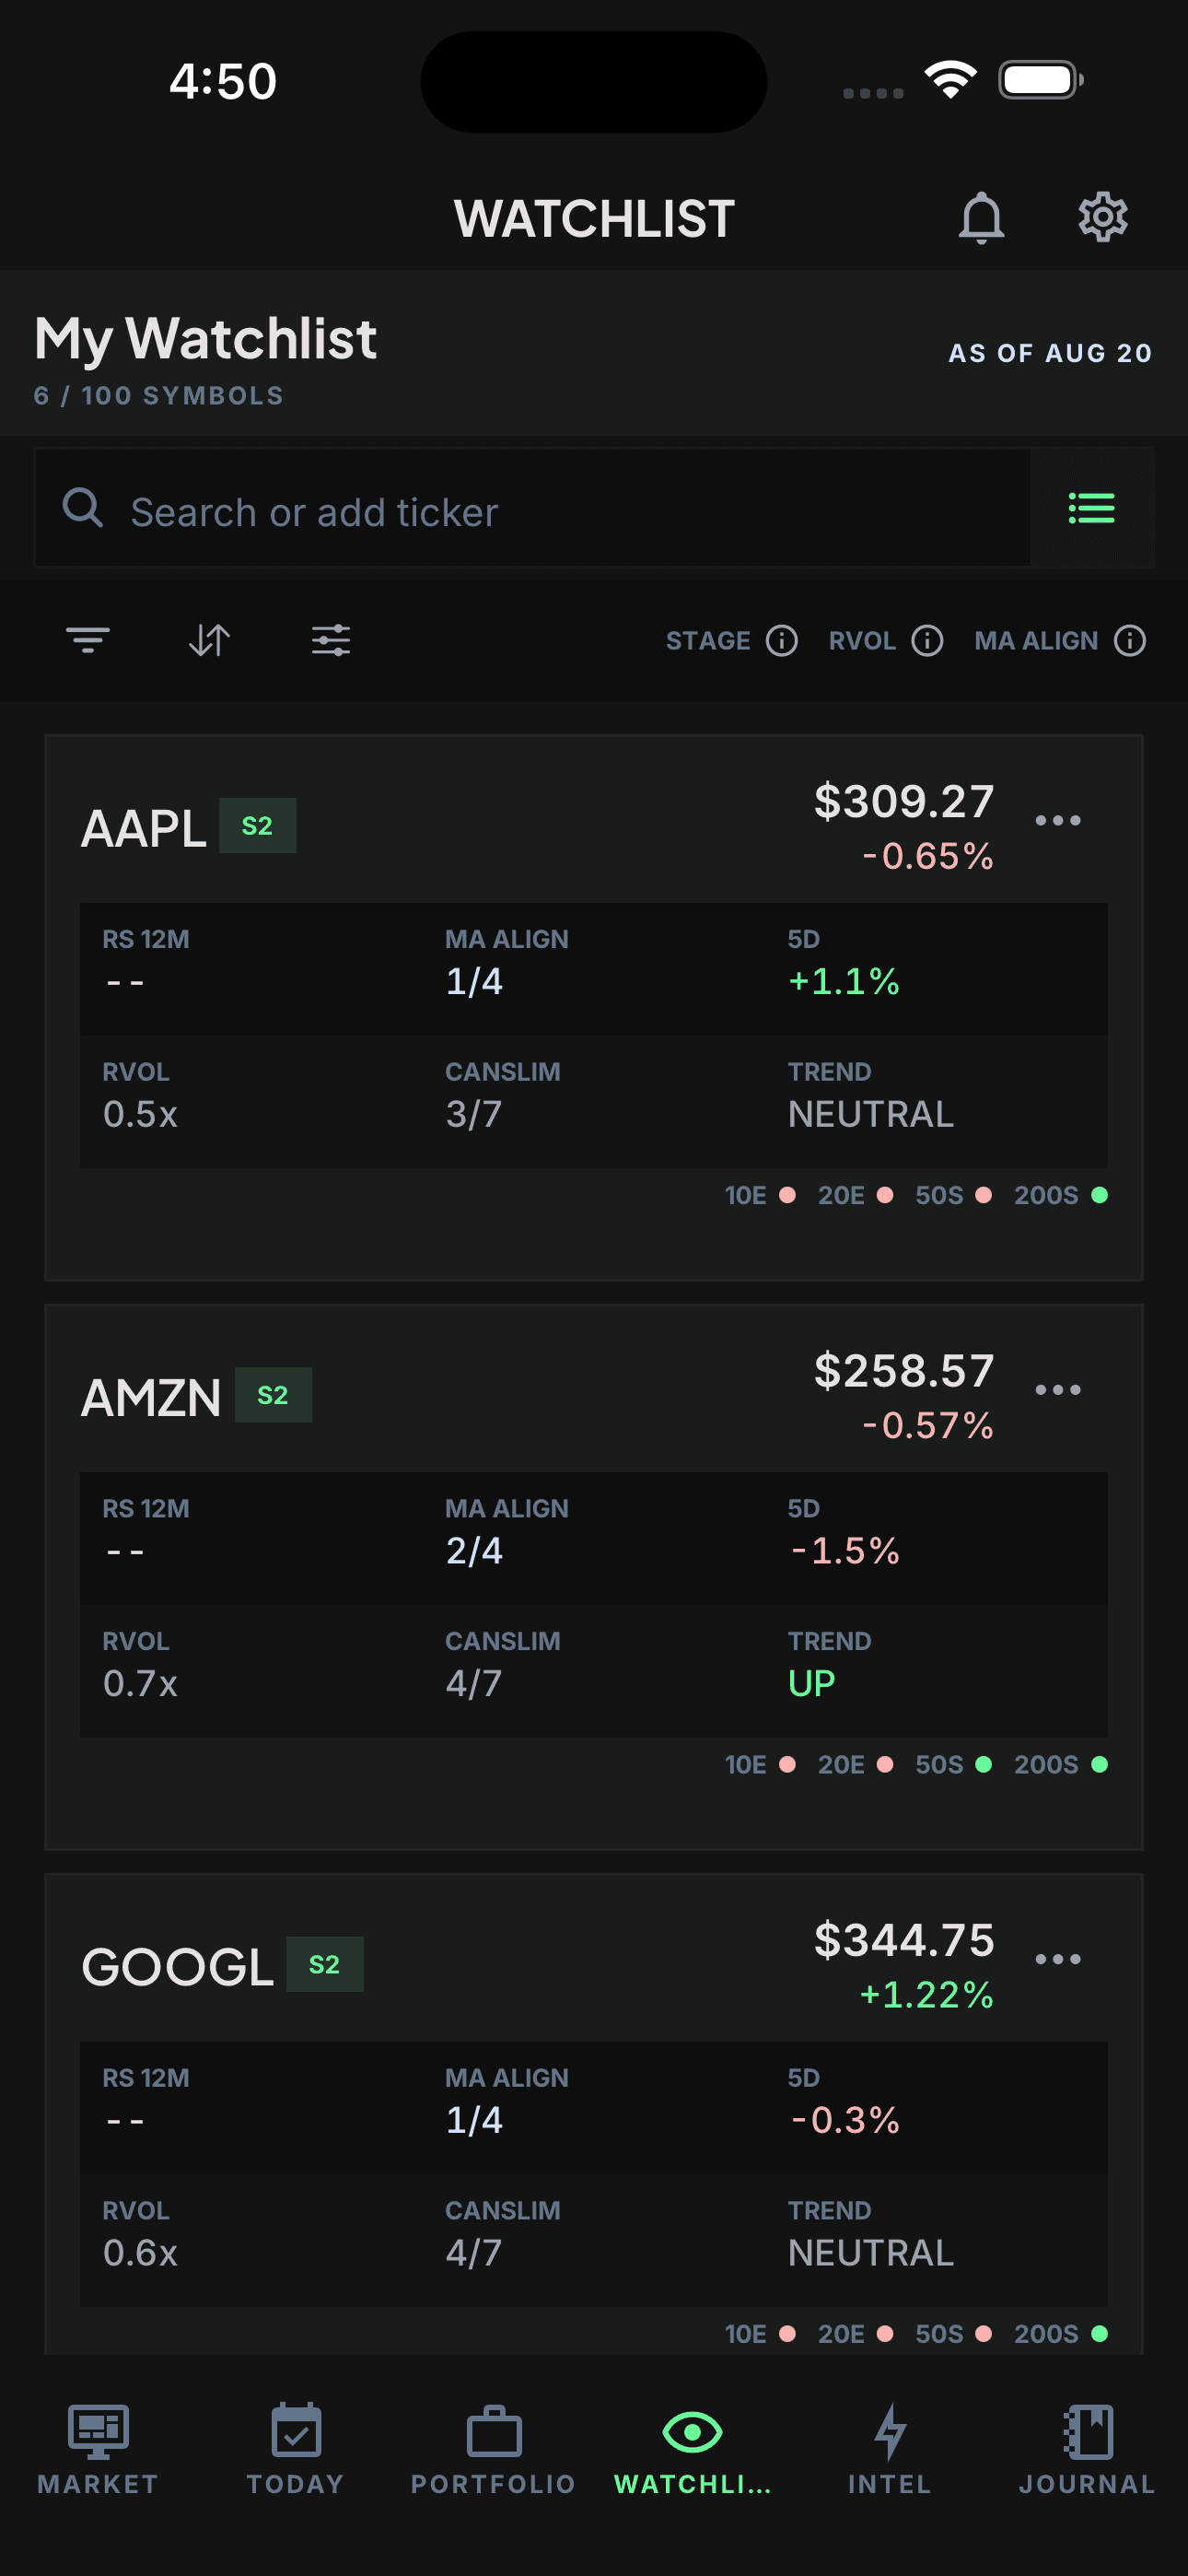
The app loads the stable daily summary and overlays short-lived quotes. That separation avoids rebuilding daily history for every quote update; it does not make every field equally fresh. The current response does not expose a per-row cache-fallback marker.
Use those controls to reduce the roster, then supply the decisions the row cannot: why the candidate is there, what you need to see next, and what removes it. If the review produces a real setup, inspect the setup structure and choose the invalidation before calculating shares.
Where this workflow breaks down
- Vague admission: “interesting” gives the symbol no testable reason to stay.
- Mixed timestamps: a fresh quote can sit beside an older daily or weekly field.
- Mechanical threshold worship: 4/4, RS 90, or near-high status can still describe a poor entry.
- No removal rule: yesterday's candidates crowd out today's evidence.
- Too many names: even a 100-symbol product limit can be far larger than one trader can review well.
- Unseen risk: a watchlist does not replace earnings, liquidity, market, correlation, or portfolio checks.
Do one cleanup pass now
Open your current roster and remove one candidate whose reason is stale or impossible to state. For one symbol that remains, write the evidence date, the next review condition, and the removal rule. Then use the TradeRegimen Start Here workflow to carry a valid setup from context through pre-trade risk and review.
FREQUENTLY ASKED
What does 4/4 moving-average alignment mean?
It means the current price is above four tracked averages: the 10-day EMA, 20-day EMA, 50-day SMA, and 200-day SMA. It does not mean those averages are ordered from fastest to slowest. A bullish moving-average stack is stricter: price above the 10 EMA, the 10 EMA above the 20 EMA, the 20 EMA above the 50 SMA, and the 50 SMA above the 200 SMA.
Is moving-average alignment a buy signal?
No. Alignment describes trend structure at one point in time. It does not evaluate a trader-defined entry trigger, stop distance, earnings risk, liquidity, market context, or portfolio risk. Treat it as a filter for further review.
Does within 10% of the 52-week high mean a stock has triggered?
No. The filter only says the current price is at least 90% of the recorded 52-week high. A trigger is a separate condition the trader defines from the chart or setup. TradeRegimen does not currently save that custom trigger in a watchlist row.
How often should a momentum watchlist be reviewed?
Review it often enough that every row still has current evidence and a useful next decision. Daily fields and intraday quotes can refresh separately. The top-level as-of label is the latest dated daily row in the response, not a guarantee that every row or field shares that timestamp.
How many stocks should a momentum watchlist contain?
There is no universal ideal. The list should be small enough to review consistently and large enough to preserve relevant candidates. TradeRegimen currently sets an operational limit of 100 symbols; that product cap is not a trading rule or a suggested portfolio size.
Run your trading like a system.
Build your Constitution, check a manual position plan when you log it, and review rule states while recorded positions are open.
Get Started